Data Literacy for IDs: The Basics You Need to Work Smarter With AI

Training can look successful on paper and still fail where it counts: on the job. We’re digging into the data literacy instructional designers and educators actually need right now, especially as AI tools speed up decisions and raise new privacy questions. If you’ve ever stared at completions, seat time, or quiz scores and wondered, “So what do I do with this information?”, this conversation is built for you.
We walk through the mindset shift that makes measurement useful: data is evidence, not the mission. You’ll hear the three traps that quietly sabotage learning measurement and training evaluation, including confusing activity with impact, optimizing for easy-to-track metrics, and sharing more learner or project data than you intended when using AI. Then we break down five practical “data basics” you can apply immediately: inputs vs outputs vs outcomes, leading vs lagging indicators, correlation vs causation, data quality basics, and privacy by design with data minimization and anonymizing habits.
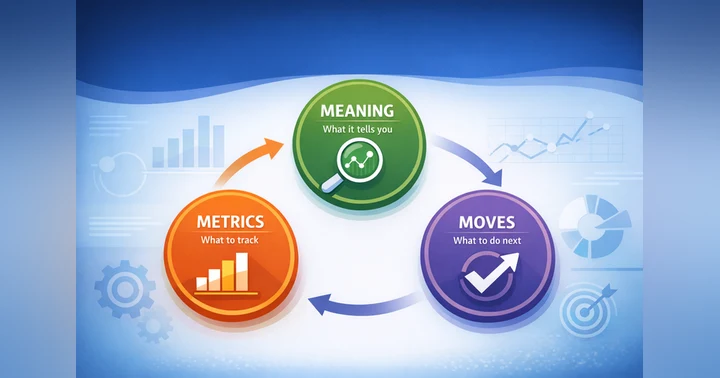
To make it actionable, we translate everything into a simple, repeatable workflow: Measure, Interpret, Act. You’ll learn how to pick one metric per layer, ask better “why” questions, and choose the smallest change to test. We also share a concrete example where a 95% completion rate hides the real problem, and how scenario-based practice plus an in-workflow job aid can drive true behavior change. If you want to feel confident talking about impact and still use AI responsibly, hit play, subscribe for the rest of the AI Ready Designer Series, and share this with a colleague who needs clearer metrics.
🔗 Episode Links
Please check out the resource mentioned in the episode. Enjoy!
Join PodMatch!Use the link to join PodMatch, a place for hosts and guests to connect.
Disclaimer: This post contains affiliate links. If you make a purchase, I may receive a commission at no extra cost to you.
💟 Designing with Love + allows you to support the show by keeping the mic on and the ideas flowing. Click on the link above to provide your support.
☕ Buy Me a Coffee is another way you can support the show, either as a one-time gift or through a monthly subscription.
🗣️ Want to be a guest on Designing with Love? Send Jackie Pelegrin a message on PodMatch, here: Be a guest on the show
🌐 Check out the show's website here: Designing with Love
📱 Send a text to the show by clicking the Send Jackie a Text link above.
👍🏼 Please make sure to like and share this episode with others. Here's to great learning!
00:00 - Welcome & Series Roadmap
01:15 - Why Data Literacy Matters Now
02:46 - Three Data Traps To Avoid
03:53 - Five Databasics For Better Metrics
05:10 - Measure Interpret Act Workflow
06:18 - Example From Completions To Outcomes
06:52 - Weekly Challenge & Resource
07:34 - Next Episode, Quote, & Support
Welcome & Series Roadmap
Jackie PelegrinHello, and welcome to the Designing with Love podcast. I am your host, Jackie Pelegrin, where my goal is to bring you information, tips, and tricks as an instructional designer. Hello, instructional designers and educators. Welcome to episode 111 of the Designing with Love Podcast. As we continue through the 2026 lineup, we're also moving through the AI Ready Designer Series. Last time, we tackled AR guardrails so you can use tools confidently and safely. Today, we'll cover the databasics you actually need, what tools may retain, and how to reduce risk without getting overly technical. So grab your notebook, a cup of coffee, and settle in, because we're going to make this feel doable. Before we jump in, a quick note. This is a 12-episode arc, and each episode builds on the last. In this 12-episode AI ready designer series, we'll move through five AI ready checkpoints each time. So you always leave with something practical you can apply right away. Alright, let's jump into checkpoint one. Here's the shift. Instructional designers are being asked to make decisions faster, and AI makes that possible. But those decisions are only as good as the data behind them. And by data, I don't mean that you need to become a data scientist or have a fancy PhD degree. What I am referring to here is you need enough data literacy to answer questions like, is this training actually working? Where are learners getting stuck? What should we improve first? And what can we safely share with tools? And what should never leave our environment? In other words, data literacy isn't about dashboards. It's about making better decisions faster. So that's the shift. Now let's ground it in the constant things that never change in learning design. Even in the AI era, the goal always stays the same. Help people perform better in real contexts. Data is just evidence. It's not the mission. So here's the steady truth. The best data literacy is the kind that helps you ask better questions, not just collect more numbers. Your job is still human-centered. Here's where you interpret what the numbers mean in context, connect metrics to real behavior, and decide what action to take. With that foundation in place, let's talk about common risks, where bad data habits create bad decisions. This is where people get tripped up, so I'm going to make it simple. Risk number one, confusing activity with impact. Completions and seat time are activity. They don't automatically prove learning or performance. Risk number two, measuring what's easy instead of what matters. If your metric is people clicked next, you'll optimize for clicking next. Risk number three, sharing more data than you realize. Some tools can store or log prompts, uploads, chat history, user account details, and integrations. Even if you don't know the exact retention rules for every tool, you can protect yourself with a simple mindset. Assume anything you paste could be stored somewhere. That's not meant to scare you. It's to encourage the right habit. Use the minimum necessary information and autonomize when needed. Now that we've named the pitfalls, let's shift to the upgrade. Five databasics that make you faster and more confident. Here are five databasics you actually need to work smarter without going deep into analytics. Inputs versus outputs versus outcomes. Inputs are time spent, attendance and effort. Outputs are completions, quiz scores, and deliverables. Outcomes are behavior change, performance improvement, and fewer errors. Leading versus lagging indicators. Leading is early signals such as practice attempts and confidence check-ins. Lagging is results such as KPIs, customer metrics, and quality metrics. Correlation versus causation. Just because two things move together doesn't mean training caused it. Data quality basics. Ask yourself, is it accurate, complete, consistent, recent? Privacy by design. Collect and share the minimum you need to achieve the purpose. That's already enough to sound confident in meetings and to protect learners. Alright, now let's translate those concepts into a quick, repeatable system. Measure, interpret, and act. Here's your simple workflow for using data, especially with AI support. Step one, measure. Pick one metric per layer. Intent metric, what success looks like, which can include one to two KPIs or behaviors. Experience metric, practice and feedback evidence. And finally assets metric. Usage or clarity. Are people using the job aid? Is it understood? Step two, interpret. Ask why, not just what. Use a three question review. What happened? What might be happening? What's the smallest change we can test? Step three, act. Make one improvement. Pick one change you can implement quickly, then check again. Here's where AI fits. You can use AI to summarize feedback themes or draft improvement options, as long as you autonomize and stay within your guardrails. Alright, so here's a simple example. A course has a 95% completion rate, but support tickets didn't drop and errors didn't change. So we look at the data differently. Completions were high, which is the output, but the real job behavior didn't improve, which is the outcome. We can add one scenario-based practice activity and job aid that lives inside the workflow. We can also track practice attempts and error rate. This is data literacy and action. Not more data, but better data. So here's your checkpoint challenge for the week. Choose one current project and write the following one outcome metric, what should change on the job, one leading indicator, what will show progress early, and one data minimization step, what you will not collect or paste. That's it. Three lines. You're working smarter already. As we wrap up, I made an interactive resource for this episode called Data Literacy Compass. It's a quick guide you can click through in just a few minutes to choose better metrics, make sense of results, and decide what to improve next, without getting overly technical. If this episode helped you, please follow or subscribe and share it with a designer who wants to feel more confident talking about impact and measurement. Next time, we'll keep building your AI ready workflow with episode 113, Human in the Loop, the review workflow that prevents rework. And we'll focus on turning these ideas into a repeatable system. Data literacy doesn't mean becoming technical, it means becoming clear. Clear about what you're measuring, what it means, and what you'll do next. As I conclude, here's an inspiring quote by Carl Sagan, an astronomer and science communicator. Extraordinary claims require extraordinary evidence. Thanks for spending time with me today. Until next time, keep it practical, keep it human, and keep designing with love. Thank you for taking some time to listen to this podcast episode today. Your support means the world to me. If you'd like to help keep the podcast going, you can share it with a friend or colleague, leave a heartfelt review, or offer a monetary contribution. Every act of support, big or small, makes a difference, and I'm truly thankful for you.